Change target group: Professionals
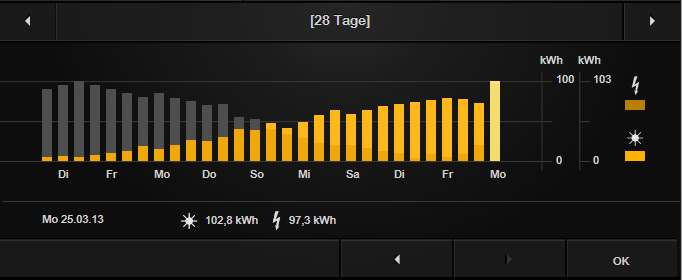
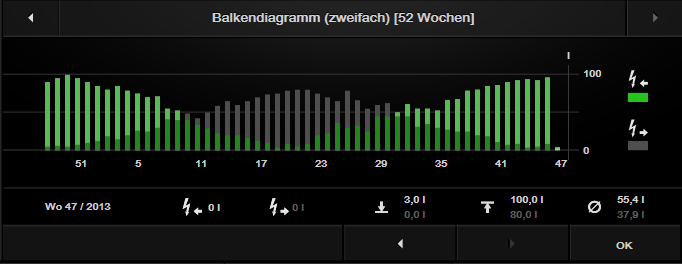
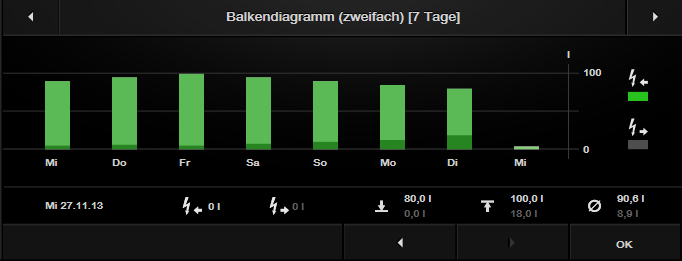
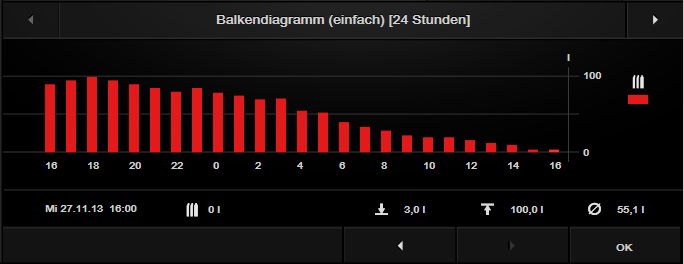
The bar graph plug-in is used to display HomeServer archive data in the form of a bar graph. Graphs with only one data archive (single graph) or graphs with 2 data archives (double graph) can be displayed. For example, using the double graph, the power generated by a photovoltaic system can be compared to the power obtained from the utility company.
The following views are available as options:
• 24-hour view
• 7-day view
• 28-day view
• 52-week view
Note: The plug-in requires the HomeServer data archive to display the measured values.
Hard- und Softwareversionen: Gira HomeServer - version 4.7.0, QuadClient from 4.7.0
Kompatible Geräte: Gira Control Clients
Gira Hardware: 1x 052900 Gira HomeServer 4 KNX
Bekannte Ausnahmen: Note: The plug-in supports the Gira QuadClient with the Design 1-4. This means that it cannot be displayed on mobile devices using the Gira app.
Realisierungsdauer: 1 hr.
Updateinformationen: Version 1.1: .Net 4.5 from Experte/QC 4.7.0
